Using Honeycomb to troubleshoot a tricky bug in production
Using Honeycomb to debug a tricky bug in production.

Despite our best efforts to squash bugs before we ship code, it is almost inevitable that at some point users come across an edge case or a loophole that hadn't been fully considered. Sometimes these are difficult to reproduce in-house, as they require certain system conditions or user state to be present. Gathering the relevant information that precipitated the issue is something made easy with tracing tools such as Honeycomb, compared to traditional logging methods. This post focuses on using Honeycomb to gain information in order to solve a reported LiveOps issue.
Jan 13, 2022 - 5pm
A community manager has reported a loophole where players can collect more than one clan event leaderboard reward.
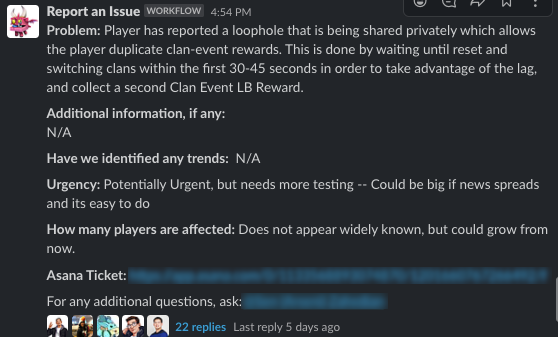
Any time users can gain more than the designed amount, it is a pretty urgent issue for us to investigate. Depending on the scale, it could severely impact the long-term economy of the game. It's also pretty difficult to retroactively correct, as users may have converted the extra rewards into other resources, or consumed them for other benefits which can be challenging to track or reverse. In short, we want to understand the issue as soon as reasonably possible.
Jan 13, 2022 - 7pm
We have a table in BigQuery that logs all reward information given to all users for all time. It's useful both for analytics and troubleshooting. I use it to confirm the issue is actually happening, and not something users are making up.
After confirming the issue, I look over the relevant code responsible for determining the rewards the user is able to be collect. It isn't obvious what's wrong; the logic seems to be sound, and so I suspect that one or more of the values being evaluated must have an unexpected value, leading to incorrect results. The options I had on hand to inspect the values being passed in are either adding logging or using Honeycomb traces.
Because users reported that this only happens at our "daily reset" of the game (at 1PM PST all our daily in-game events and store promotions roll over) and from the BigQuery results I didn't see a large amount of users exploiting this loophole, I decide to pick this up the next day with a fresh mind.
Jan 14, 2022 - 12pm
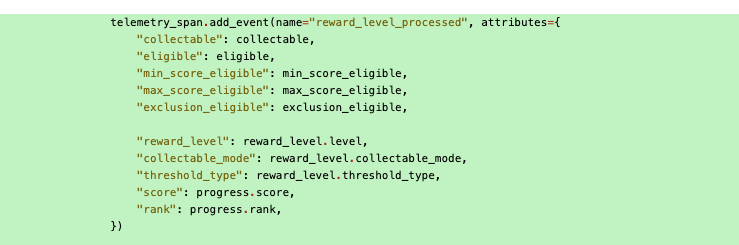
I add data that I believe to be relevant to a Honeycomb span event, which will then be available in the Honeycomb traces. I suspect the answer might be somewhere in this event.
At the same time, I also wrap other relevant functions in the expected call stack with our telemetry_wrapper Python decorator. This decorator makes it quick and easy to create telemetry spans for each function and also adds all the parameters as attributes onto the span automatically.

Our definition of telemetry_wrapper is as follows:
from typing import Any, Optional
from opentelemetry import trace
from functools import wraps
import inspect

def add_field(name: str, value: Any, max_length: int = 512) -> None:
    """
    Adds a field to the innermost span. Since opentelemetry only supports the exporting of strings, bools, ints, and
    floats, all other values will be exported as str(value)

    Args:
        name: The name of the field to add
        value: The content of the field to add
        max_length: If value is a string or is cast as a string, truncates the string beyond this many characters.
                    If max_length is less than 0, length is not limited.
    Returns: None
    """
    if not isinstance(value, (str, bool, int, float)):
        value = str(value)

    if isinstance(value, str) and 0 < max_length < len(value):
        value = value[0:max_length] + "..."

    trace.get_current_span().set_attribute(name, value)

def telemetry_wrapper(name: Optional[str] = None):
    """
    Decorator that wraps a function in a span, adding all of its arguments as columns in the span.

    Args:
        name: The name of the span

    Returns: A wrapper function
    """
    def wrapper(func):
        @wraps(func)
        def inner(*args, **kwargs):
            _name = name
            if _name is None:
                _name = "[" + func.__name__ + "]"

            # Square brackets to indicate that this span is automatically created with the telemetry wrapper
            tracer = trace.get_tracer(__name__)
            with tracer.start_as_current_span(_name):
                arg_names = inspect.getfullargspec(func).args
                for arg_name, arg in zip(arg_names, args):
                    add_field(name="- " + arg_name, value=arg)
                for key, value in kwargs.items():
                    add_field(name="- " + key, value=value)
                return func(*args, **kwargs)

        return inner

    return wrapper
We use Refinery as a sampling proxy for Honeycomb events. Applications send trace data to an EC2 Refinery cluster, where the data is filtered and assembled into full OpenTelemetry traces based on our provided configuration.
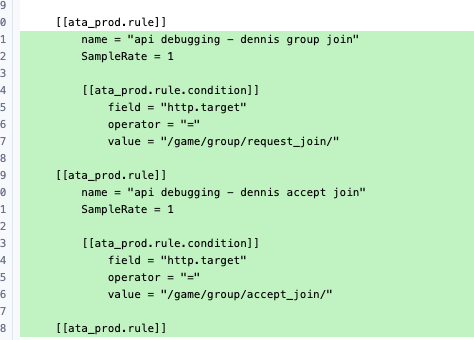
I update the configuration to forward the most relevant traces to Honeycomb without any sampling.
After doing this, I wait for 1pm to roll around and for some users to reproduce the loophole.
Jan 14, 2022 - 1:30pm
First, I use BigQuery to find a specific user who used the loophole around 1 pm. Then, I find this user's traces in Honeycomb and look through them for the debug spans I had put in earlier.
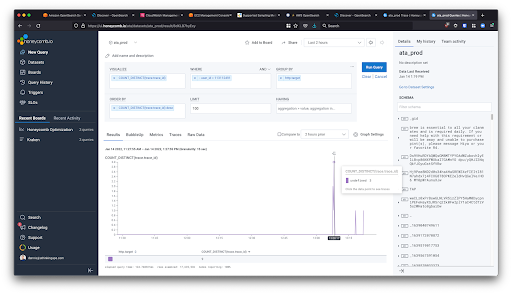
I look into the values being evaluated in the debug spans and notice the issue.
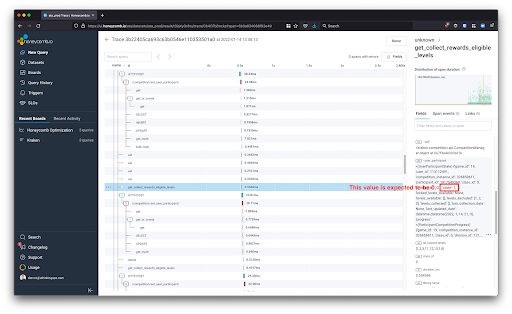
In the end, I was lucky, and the unexpected value happened to be captured in one of the telemetry_wrapper spans, and not in the custom span event I had added.
Jan 14, 2022 - 2:30pm
A bug was allowing users to collect extra leaderboard rewards after re-joining a clan. I code the fix and a unit test and then deploy it.
Jan 17, 2022 - 4pm
Confirm with BigQuery and our community managers that the duplicate collections are no longer happening.
Takeaways
If I didn't use Honeycomb and used logging instead, I wouldn't have resolved the issue until Jan 17 because the actual value that was wrong was not in the list of variables that I suspected were wrong. I would have probably needed another round of debug logs to figure it out.
This was more of luck with our function wrapper for telemetry, capturing all parameters for the trace. Because Honeycomb encourages high-cardinality event data, and has a clean user interface to query, view and drill down to the relevant data, there was no issue in adding more telemetry data than I thought was needed.
Also, since the bug was within a nested function called frequently in other cases, regular logging may have added an overwhelming amount of noise to the logs. On the other hand, with Honeycomb, the particular API flow that needed debugging can be filtered using Refinery rules, and any irrelevant cases can be sampled out.